Better Data Visualisation for Commercial Success and Social Good
Virtual Conference - 28 May 2020
Supported by
Paul Laughlin
Conference Co-Chair
Vanessa McIntyre
Conference Co-Chair
Jon Schwabish
Elevate the Debate
Anna Whayman
Building an Insight-Driven Organisation
Jacob Robinson
Learning as We Go
Emma Cosh
Visual Design Principles for Data Visualisation
Lars Verspohl
Exploring Open-Source DataViz Tools
Bridget Cogley
Data Ethics | Applied Colour Psychology
Kim Baas
Google DataStudio: An Unbiased Introduction
Joshua Smith
Story as Craft: Data & Documentary
Fi Gordon
Viz Guidelines to Empower Analysts
Andras Vicsek
Visualising Organisational Networks
Steve Hulmes
Making Analysis Work for Business
Nadieh Bremer
Visualising Connections
Simon Beaumont
Building an Analytcs Culture
Mina Ozgen
Aim, Audience, Alert. Result: Action
Jane Zhang
Making a Living as a Freelance DataViz Designer
Neil Richards
Building DataViz Communities
Sarah Nell-Rodriquez
Understand and Cultivate Data Literacy
Gwilym Lockwood
Overcoming Maths Aversion
Speakers from across the globe – Data Visualisation, UX/UI, Business Intelligence, Analytics, External Communications and more
Previous event:
DATAVIZLIVE – London
25 February 2020
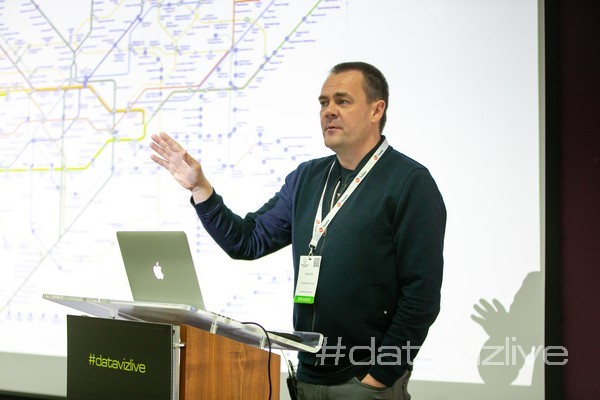
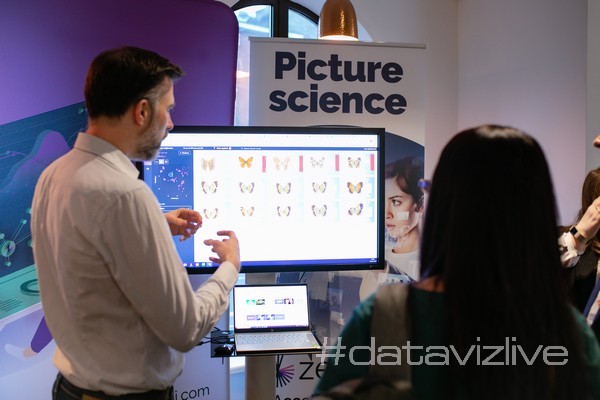
Every seat filled – see what people thought:
Who is this event for?
Anyone that uses data to communicate internally or externally. Whether you’re a specialist, a manager, an executive, an independent designer or a journalist, you’re welcome to come and share in the knowledge.
Over the last 3 years, Tucana DataViz events have been attended by people in:
-
Business Intelligence Operations
-
Culture & Data Literacy HR, Learning & Recruitment
-
Workforce & Resource Planning Data Visualisation & UX/UI Design
-
Application Development Finance & Compensation
-
Reporting, Analytics & Data Science Business Partners
-
Marketing & Communications Data Journalism
-
Project Management & Consulting IT, Systems & Data Management
-
Process & Business Performance Strategy & Organisation Design
Everyone is welcome – any sector, any domain, any country, and any level of technical ability.
Across the four tracks, you will find sessions to meet your objectives for 2020.
Multiple tracks: choose your sessions, build your own agenda
Track A: Strategy

- Developing the workforce to better understand and use data visualisation
- Cultural awareness for better communication
- Developing analysts to be better data visualisers
- Bridging the communication gap with business leadership
- Building a data visualisation competency team or CoE
- Creating effective governance to improve adoption
- Transparency and ethics in data visualisation
- Understanding bias, manipulation and misrepresentation in DataViz
Track B: Design
- Creating more effective BI dashboards and portals
- Contextualisation and narrative planning
- Introducing animation and interactivity into visuals and dashboards
- The psychology of grouping, framing and storytelling
- How colour affects visual impact and user experience
- Optimising the UX when building a dashboard
- How to choose the correct visual based on message and audience
- Assessing the effectiveness of visual design, and constructive critique

Track C: Skills

- Exploring open-source software and toolkits for data visualisation
- Automating the creation of bespoke visualisation
- Working with multiple data sources, building advanced dashboards
- Hand sketching data visuals
- How to interview customers to better understand their needs
- DataViz coding for analysts, how to think more visually
- Data science for designers, how to think more analytically
- Advice on starting out as an independent designer or design agency
NEW: Showcase
Presentations from people and companies that are improving how we visualise data and make an impact in business and media
Meet
…designers, coders and agencies that can transform your project
Discover
…technology that can create dazzling visuals and dashboards
Learn
…from emerging pioneers with new knowledge to share

Get On-Demand access to all presentation videos and slide decks from all DataVizLive events, both in-person and online.
PLUS: Stand-alone content added regularly, including interviews, presentations, demos, technology explorations, and live coding.
The event might be virtual, but the attendees are real
Connect with creative developers, designers, leaders and learners in other companies.
Make new connections – who knows where they might lead…
Multiple opportunities for video networking in small groups, or one-to-one
Find people in your local area, or on the other side of the world
Meanwhile - the network is growing
Social network for DataVizzers – sign up for free
Start conversations, share links, ask for advice and build your network
For general queries, email info@dataviz.live
To discuss sponsorship or exhibition, email us at sponsor@dataviz.live
To discuss by phone, call us on +44 (0)203 290 3221
or WhatsApp +34 634 79 66 11
Get involved! The network is growing daily
Be a part of this event, and join the growing movement of DataViz professionals that are driving business forward.
If you’re not ready to join just yet, let us know where to reach you, and we’ll keep you in the loop – you’re welcome to join any time. Unsubscribe permanently with one click if you ever change your mind.


